Your financial data runs on Priority. Now you can also see where you are over budget, while you can still adjust.
One data warehouse on top of Priority, with dashboards for budget against actual and P&L by profit center. Without stitching reports in Excel.
For finance managers and controllers on Priority
If the actuals are already in Priority and the budget is in Excel, the comparison is done by hand. What is left is seeing it in one place: budget against actual by line, and profitability by profit center, without waiting for the quarter close.
The data comes from Priority, and metrics are calculated once in the data warehouse, so the numbers stay consistent across every report.
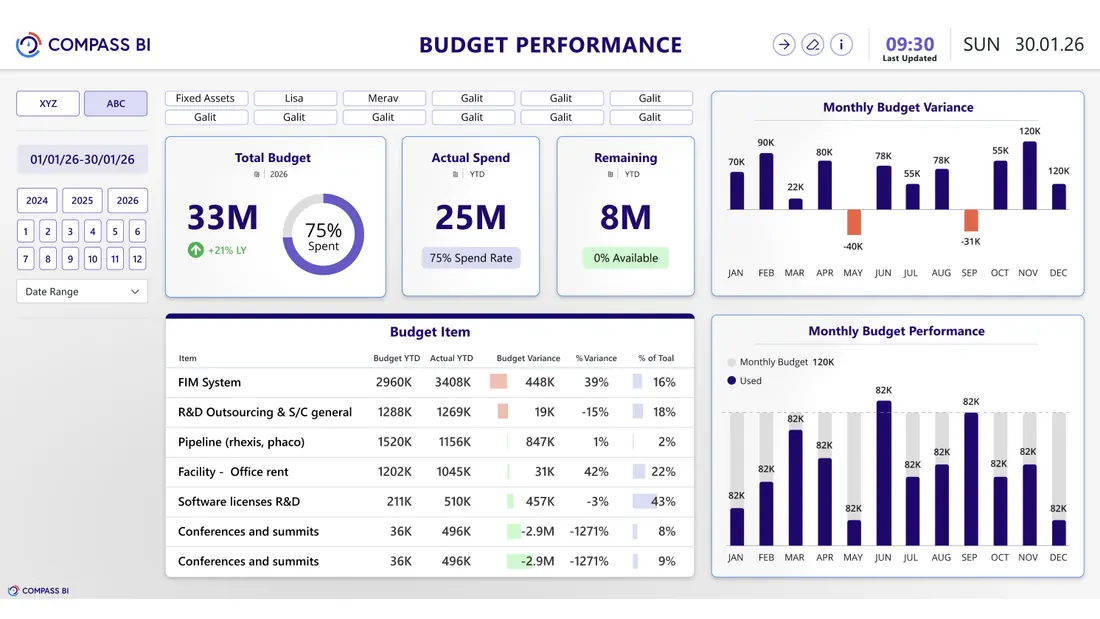
Budget & Variance Control
The problem
The budget is built in Excel at the start of the year and the actuals sit in Priority. Comparing them is done by hand, usually once a quarter - which means a variance is discovered after it has happened.
The solution
One module that puts budget against actual on the same screen, line by line, with the variance in money and in percent and what is left for the rest of the year. Your budget file connects as a data source, and the actuals update themselves.
What you see
Total budget, execution and remainder · budget lines with variance in money and percent · budget variance by month · execution against the monthly budget
P&L
The problem
The P&L arrives after the month closes, at whole-company level. Anyone who wants to know what a profit center contributed takes it apart by hand - and in a group, consolidates across companies as well.
The solution
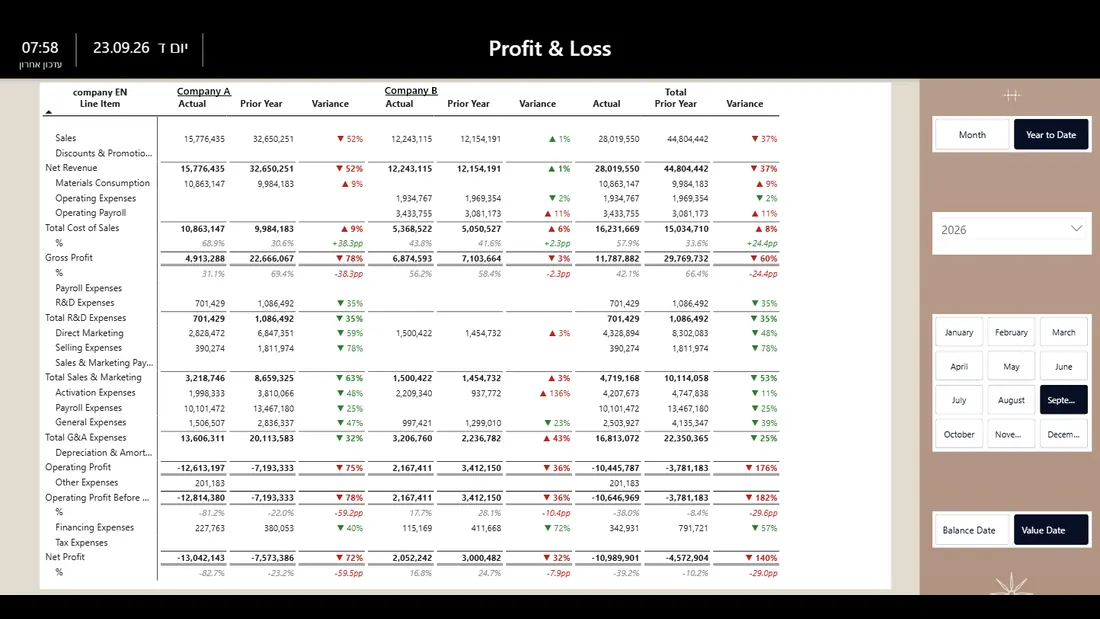
One module doing both jobs: profitability by profit center, and consolidation of several companies into one picture. Costs are allocated to profit centers by a key agreed with you, and the group is presented in the same structure - without merging files.
What you see
A P&L for every profit center, company and the group · in one structure · comparison with the same period and with budget · a path from a report line to the entries behind it
Connect in one day. Live within weeks.
- Connect to Priority. No changes to your ERP processes.
- Choose a first module. Budget control or P&L, whichever is more pressing.
- Go live. Dashboards on one data warehouse, with consistent numbers across every report.
Frequently asked questions
What do budget control and P&L show?
In budget control: budget, execution and remainder, budget lines with variance in money and percent, and variance by month. In P&L: a report for every profit center, company and the group in one structure, comparison with the same period and with budget, and a path from a report line to the entries behind it.
How do you connect, and how long does it take?
You connect to Priority without changing any processes in the ERP. You connect in one day and go live within weeks. You start with a first module: budget control or P&L, whichever is more pressing.
Who is it for?
For finance managers and controllers on Priority. If the actuals are in Priority and the budget is in Excel, the comparison is done by hand. Here you see it in one place, without waiting for the quarter close.
How do we start?
Leave your details in the form and we'll get back to you within one business day. You can also start by seeing what it looks like.
- An official Priority technology partner since 2021.
- 20+ years of experience.
- Dozens of managers make decisions through us.
We'll Get Back to You Within One Business Day
We've got your inquiry
We'll come back to you within one business day. If it's urgent, here are the fast routes:
That didn't send
Something went wrong on the way to us and the inquiry was not sent. You can try again, and reach us directly: